Tuesday, December 10, 2024

Week 15-16 Types of data in electronic spreadsheets

OBJECTIVE OF THE CLASS

Identify the types of data that can be entered into cells to work with data of different types as requested or needed.

TYPE OF DATA

In spreadsheets, large amounts of data can be manipulated, so it is very important to know what type of data is being represented or used when creating our own content, that is, it is necessary to know if the format and appearance of the data is correct. To identify the types of data I recommend you remember the following:

The data that can be entered into the cells can be…

  • Number. They are combinations of digits. It can be used to include numbers, dates, times, etc. In the case of dates and times, they must be entered with a specific date format.
  • formulas. They are expressions that always begin with the equal sign, =, and contain operators or functions involving references to other cells.
  • Text. They are sequences of characters (letters or symbols) that are not or are not identified as numbers or formulas.

It is important to recognize what type of data you are going to use both to recognize what the content of the table is about and to avoid errors when using formulas and/or functions.

To modify the type of data that you enter in a cell (and be sure that it is the correct type) we can use the "More formats" icon


in which we can select the different types of formats that you can use, you can also select from the FORMAT menu in the NUMBER option directly the type of data to manipulate.


ACTIVITY 01
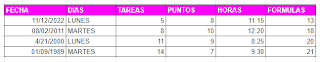
We will carry out a couple of short examples together to understand how and when to use some of the data types, try creating this small table and after completing the class notes, carry out the activity that will be published in the classroom


CLASS NOTES
Write as always in your notebook the title of the class, the objective, write down the most relevant of the class taking note of what is published in the blog and what the teacher shared with you and at the end answer the following questions  with your own words:

What is a data type in the spreadsheet?
Why do we consider it important to enter the data in a table correctly?
Which error(s) can appear if you use an incorrect data type?

Tuesday, November 26, 2024

Week 13/14 - Creation of a crossword in a Google spreadsheet (Borders, Fill, Font, Comments).

OBJECTIVE OF THE CLASS

Create a crossword in a Google spreadsheet, using the fill, border, font, cell alignment formats and add comment to cells.


EDGES, FILLING We can give a little life to our spreadsheets by adding borders and background colors to the cells using the border and cell fill tools, in the previous class we already used a simple example of the design of tables in spreadsheets : To add a border:

  1. Select a cell or range of cells.
  2. Click on the Borders button. A menu of border options appears. There, you can select where the borders appear, around the outside of the selection or cell borders within the selection.
  3. Select a border option.


To put a fill color:

  1. With a cell or range of cells selected, click the Fill Color button.
  2. Select a fill color.


WE WILL CARRY OUT THE EXAMPLE TOGETHER WITH YOUR TEACHER


COMMENTS IN CELLS To insert a comment in a cell (such as a type of annotation or message to highlight in a specific cell) we simply do the following 3 steps:

  • Click on the cell to which you will add the comment.
  • Look in the menu that appears for the “comment” option.

  • A space will appear in which the text you want to put as a comment will be added and that's it.


CLASS NOTES (PREVIOUS INVESTIGATION)


You’ll search for short definitions of the next programs or apps of Google and Microsoft. Each definition will have between 10 and 15 words and you’ll write them in your notebook.


Google

Gmail

Drive

Docs

Slides

Sheets

Sites

Chrome

Forms

Meet

Classroom


Microsoft

Windows

Edge

Word

PowerPoint

Excel

Outlook

Teams


You’ll also write down the Web addresses from where you read the definitions.


CLASS ACTIVITY

Today we will put into practice the learnings from the previous class in creating a crossword like the one shown below.


INSTRUCTIONS

  1. Open Google Drive and find the folder where the new file will be created.

  2. Use the NEW button and select the SPREADSHEETS option.

  3. Change the file name to “CELL FORMATS”.

  4. Select the columns and adjust their width so that they appear square.

  5. Now copy the texts and the formats. Try to place them in the same cells as the image.

  6. The formats are as follows

    1. The cell fill is called "dark blue 3"

    2. The edges of the table are gray

    3. The color of the letter inside the table is also "dark blue 3".


Now you have to indicate the definitions so that they can answer your crossword. For this we will use "Comments"


These comments will be inserted in the cells indicated with a small red triangle.


  • To create a comment you have to right click on the cell where it will be inserted.

  • Type in the definitions that you investigated in Personal Work and also indicate if the word is written in Horizontal or Vertical.


When you finish all the formats, the 17 comments with the definitions and your personal data, you will send the file through the publication of Activity in the new Classroom of your group.


Monday, November 18, 2024

Week 12 - What is a spreadsheet?

 OBJECTIVE OF THE CLASS

Identify the essential elements of the spreadsheet work environment, its essential components and the key elements to start working on spreadsheets.

WHAT IS A SPREADSHEET?

It’s a grid shaped file where you can save information of many kinds such as texts, numbers, dates, links and you can also perform simple arithmetic calculations through operators or functions.It is also a tool with which we can organize and locate information, in addition to creating graphics of different types.
The main elements in a worksheet are cells, columns, and rows. Each of these has a unique name that allows us to identify
them. How do we know the name of each of these elements?


Don’t forget that columns are vertical sets of cells with letter names. Rows are horizontal sets of cells with number names.


PROCEDURES FOR SELECTING CELLS

Although the logical procedure to select in a spreadsheet is to drag with the mouse, I’ll indicate to you some other procedures that you have to know.


  • By clicking on a cell or by using the arrow keys you can select a single cell.

  • By dragging with the mouse or using Shift plus the arrow keys, you will select a range, that is, a set of

cells all together.
  • By clicking on the names of the columns (letters) or rows (numbers) you will select them. You can also

drag over the names to select multiple columns or rows.
  • To make separate ranges selections you can press the "Control" key to keep the previous selection.


CELL FORMATS

Although there are different types of formats that can be applied to the content of a cell, this time we will only know the basics.

  • Font

  • Filling

  • Alignment and orientation

  • Borders


Week 11 - Exam Review (Statistics) / Cover page design

OBJECTIVE OF THE CLASS
To Know the main elements and procedures of a Spreadsheet and also some basic cell formats, through a simple exercise
with the collected results from a form.

BEFORE STARTING…
Let's review together the results of your summative evaluation to recognize which aspects were achieved and which,
although you have seen or worked on them, will remain as a pending signature. Let's look at the results.
NOTE: REMEMBER TO MAKE THE PERIOD COVER JUST AFTER YOUR NOTE BREAKDOWN TABLE.


Tuesday, November 5, 2024

Week 9. Generation of concentrated documents

 OBJECTIVE OF THE CLASS

We explore the generation and analysis of documents, graphs, and statistical tables using Google Forms results. We will understand what they are, how they are created and what they are useful for in different contexts either using real or fictitious examples.


Analyze the collected data Analyze data collected through the “Summary” tool of a Google Form for informed decision making.

What are documents, graphs and statistical tables?

Definition of documents: A document is a file containing textual information, such as text, images and other elements, used to record, present and share information.

Definition of statistical graphs: Graphs are visual representations of numerical data that allow a quick and clear understanding of trends and patterns.

Definition of statistical tables: Tables are an organized way of presenting data in rows and columns to facilitate comparison and analysis.

What are these resources useful for?

Effective communication of results: How documents, graphs and tables help communicate findings clearly and convincingly.

Informed Decision Making: How these resources facilitate data-driven decision making.

Examples of applications in everyday life and in the professional field.

How and where are documents for statistics generated in Google Form?

In plenary we will open a form with answers to begin exploring the documents and information that the form automatically generates.

Now go to the tab of your form called “RESPONSES”

Together we will give a quick review of everything that is there and how it can be useful to us.


Tuesday, October 15, 2024

Week 7-8 Sections management and submission of a form

OBJECTIVE OF THE CLASS

Create and organize the sections of a form, as well as its submission, using Google Forms to develop technical skills in designing clear and functional forms, understanding the importance of structuring information logically and efficiently.


HOW TO ADD SECTIONS IN GOOGLE FORMS (Organize questions in my form)

To create a section in your form, click the Add section icon, which looks like an equal sign, from the question menu.


When you activate a section in a form you can add a name at the beginning to identify that it is another part of your form.

 You can also add new questions and drag them between sections, if necessary. This is handy because it allows you to write your questions first and worry about sorting them into the appropriate sections later.

As you create the form, every section will appear together on one page for easier editing.

If you want certain people to see only certain sections of your form, you can. The simplest way to do this is by creating a multiple-choice question, then setting rules based on the answer provided.


In class we are going to create an example together.

DELIVERY OF A FORM TO BE ANSWERED

To collect information from many people it is necessary to send them the form. Remember that you should NOT send the edit address of a form.


The correct way to submit a form is done with the SEND button. These are the options:

  1. By email
  2. Providing them the link
  3. Embedding the form in a web page

In this class I will give you the address of a form so that you can answer it through a link


Monday, September 23, 2024

Week 5-6 Create a questionnaire in Google Forms

OBJECTIVE OF THE CLASS

Identify the types of questions and create the first form with Google Forms with questions of the paragraph

type, options and check boxes, with the subject of personal preferences.

TYPES OF QUESTIONS

The previous class talked about the importance of data, information and everything that can be done with it, but now it is time to think for a moment How many types of questions exist or are the most common? What kinds of tools can i use for a survey? How to decide what type of question to use and for what?


As in the previous class we are going to carry out an investigation to clarify our doubts and to be able to carry

out our activity.


ACTIVITY 01 (Part of your notes)

Answer the questions in your notebook and write down the URL from where you got the information:

Research on the Internet and answer:

  1. What is the difference between open questions and closed questions?
  2. Search the name of at least 3 types of closed questions.
  3. Which of these two types of questions is easier to analyze? Why?
  4. Do you remember how can we connect the results of a form and a spreadsheet?
NOW YOU HAVE TO SELECT AND CREATE


LET'S REMEMBER WHAT A FORM IS AND WHAT IS IT USED FOR

It is one of the many services included in a Google account, which allows us to collect information, via the Internet, through questionnaires.

In the current situation, this service will help us to collect data without coming into contact with  other people.


The design of questionnaires in Google Forms offers us different types of questions, some open

and others closed, as well as audiovisual resources, such as images and videos on YouTube.


GOOGLE FORMS

To create a form you can do it from Google Drive. Open it and follow the instructions.

  • Select the folder where you want to create the form file, in this case the TECNO folder.

  • Use the NEW(Nuevo) button to select FORM.

  • Very important, you must give the form a title and a file name. I suggest the same name for both.

In this case "Survey on consumption of series and movies"
  • Remember that this questionnaire will be sent to many people, so I ask you to make a description

of what they will answer and why.


DESIGN OF THE QUESTIONS

From now on, you will create the survey questions one by one. You should always think about whether the

question will be, open or closed.

  • For open questions you will use the options: short answer or paragraph

  • For closed questions you will use: multiple choice, check boxes or drop-down list.

Then you will create the question and the possible answers.


ANSWER CONFIGURATION

There are important settings for the answers

  • Make a mandatory answer, that is, the user cannot leave it blank

  • Randomize the answers, or shuffle them.

  • Validation, that is, checking that the answer meets special conditions.


ACTIVITY 02

For our practice you will make the following configurations:

  1. All questions must be answered, that is, the answer will be mandatory.

  2. In the options questions you will use “random order”.

  3. You will validate questions about personal information

    • In the name, in length no more than 25 letters.

    • In age, numbers between 10 and 70


APPEARANCE OF THE FORM

To finish, you will change the appearance of the form with the button shaped like a color palette, at the top

right of your form.

Select the color you want and change the header image. This time the choice is free.


Do you want to see how your first form turned out? Use the eye-shaped button (next to the color palette),

so that you see it as your respondents will see it.


*****QUESTIONS OF THE DAY:

  • What topic was discussed in class today?
  • Why do you think it is important to design or prepare the questions before creating a form?
  • In your school or daily life, do you think that online forms are useful for something? write an example


Tuesday, September 17, 2024

Week 4 - Introduction to statistics and data collection.

 CLASS OBJECTIVE

Know the basic elements of statistics, focusing on the most common data collection methods to perform data analysis effectively.

INTRODUCTION

As a person, students or professionals who are part of an educational community and who carry out the teaching-learning process every day we generate a lot of information, sometimes written, sometimes oral, and in the last year we created a lot of digital or electronic information . 


In the class read, observe, ask and write.


DATA COLLECTION (Reflection work)


Answer the next questions (Homework 2) with at least 20 words each. If you can´t search on the Internet, ask your friend to help you with the answers.


How do you imagine a Data Collection process in an investigation? 

What would you do to collect information? 

In your opinion, What are Data Collections for?

How is all the collected data analyzed?

Have you ever had to answer a Survey?


Let's review the answers you have.


STATISTICS

Statistics is the science of collecting, organizing, presenting, analyzing, and interpreting numerical data in order to make more effective decisions.

Statistics are very useful not only to collect and describe data, but also to interpret the information obtained, which can be used to demonstrate the evolution of a phenomenon over time.


DATA COLLECTION METHODS

They are the strategies and instruments with which the information and data that will be analyzed are obtained.


Observation

The person or team in charge of data collection is the one who observes, as its name indicates, the research subjects.


Interview

In an interview there is a personal contact with those who have information, they are asked directly.

Questionnaire

As in an interview, the information is obtained directly from people involved in the investigation, but through printed or other resources, such as electronic ones. This is where the Internet Forms are applied.


GOOGLE FORMS

It is one of the many services included in a Google account, which allows us to collect information, via the Internet, through questionnaires.

In the current situation, this service will help us to collect data without coming into contact with other people.

The design of questionnaires in Google Forms offers us different types of questions, some open and others closed, as well as audiovisual resources, such as images and videos on YouTube.


What do you want to know about your group? Do they like the same as you? Do others think or think the same as you? What does the community need to know?


We will use Google Forms to collect information and will organize and analyze it statistically.