Tuesday, November 26, 2024

Week 13/14 - Creation of a crossword in a Google spreadsheet (Borders, Fill, Font, Comments).

OBJECTIVE OF THE CLASS

Create a crossword in a Google spreadsheet, using the fill, border, font, cell alignment formats and add comment to cells.


EDGES, FILLING We can give a little life to our spreadsheets by adding borders and background colors to the cells using the border and cell fill tools, in the previous class we already used a simple example of the design of tables in spreadsheets : To add a border:

  1. Select a cell or range of cells.
  2. Click on the Borders button. A menu of border options appears. There, you can select where the borders appear, around the outside of the selection or cell borders within the selection.
  3. Select a border option.


To put a fill color:

  1. With a cell or range of cells selected, click the Fill Color button.
  2. Select a fill color.


WE WILL CARRY OUT THE EXAMPLE TOGETHER WITH YOUR TEACHER


COMMENTS IN CELLS To insert a comment in a cell (such as a type of annotation or message to highlight in a specific cell) we simply do the following 3 steps:

  • Click on the cell to which you will add the comment.
  • Look in the menu that appears for the “comment” option.

  • A space will appear in which the text you want to put as a comment will be added and that's it.


CLASS NOTES (PREVIOUS INVESTIGATION)


You’ll search for short definitions of the next programs or apps of Google and Microsoft. Each definition will have between 10 and 15 words and you’ll write them in your notebook.


Google

Gmail

Drive

Docs

Slides

Sheets

Sites

Chrome

Forms

Meet

Classroom


Microsoft

Windows

Edge

Word

PowerPoint

Excel

Outlook

Teams


You’ll also write down the Web addresses from where you read the definitions.


CLASS ACTIVITY

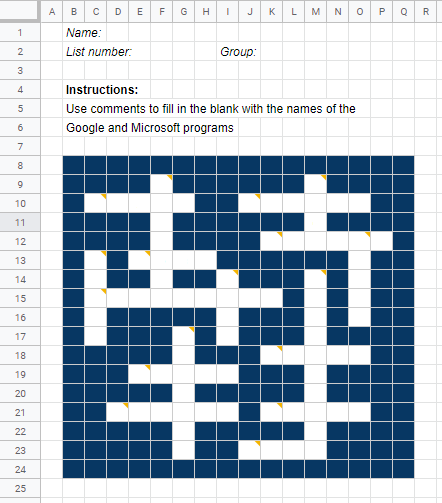
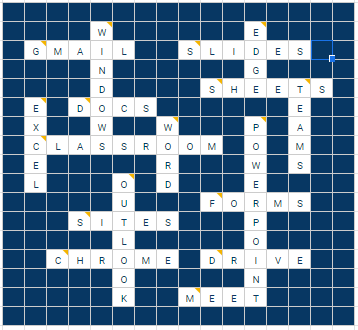
Today we will put into practice the learnings from the previous class in creating a crossword like the one shown below.


INSTRUCTIONS

  1. Open Google Drive and find the folder where the new file will be created.

  2. Use the NEW button and select the SPREADSHEETS option.

  3. Change the file name to “CELL FORMATS”.

  4. Select the columns and adjust their width so that they appear square.

  5. Now copy the texts and the formats. Try to place them in the same cells as the image.

  6. The formats are as follows

    1. The cell fill is called "dark blue 3"

    2. The edges of the table are gray

    3. The color of the letter inside the table is also "dark blue 3".


Now you have to indicate the definitions so that they can answer your crossword. For this we will use "Comments"


These comments will be inserted in the cells indicated with a small red triangle.


  • To create a comment you have to right click on the cell where it will be inserted.

  • Type in the definitions that you investigated in Personal Work and also indicate if the word is written in Horizontal or Vertical.


When you finish all the formats, the 17 comments with the definitions and your personal data, you will send the file through the publication of Activity in the new Classroom of your group.


Monday, November 18, 2024

Week 12 - What is a spreadsheet?

 OBJECTIVE OF THE CLASS

Identify the essential elements of the spreadsheet work environment, its essential components and the key elements to start working on spreadsheets.

WHAT IS A SPREADSHEET?

It’s a grid shaped file where you can save information of many kinds such as texts, numbers, dates, links and you can also perform simple arithmetic calculations through operators or functions.It is also a tool with which we can organize and locate information, in addition to creating graphics of different types.
The main elements in a worksheet are cells, columns, and rows. Each of these has a unique name that allows us to identify
them. How do we know the name of each of these elements?


Don’t forget that columns are vertical sets of cells with letter names. Rows are horizontal sets of cells with number names.


PROCEDURES FOR SELECTING CELLS

Although the logical procedure to select in a spreadsheet is to drag with the mouse, I’ll indicate to you some other procedures that you have to know.


  • By clicking on a cell or by using the arrow keys you can select a single cell.

  • By dragging with the mouse or using Shift plus the arrow keys, you will select a range, that is, a set of

cells all together.
  • By clicking on the names of the columns (letters) or rows (numbers) you will select them. You can also

drag over the names to select multiple columns or rows.
  • To make separate ranges selections you can press the "Control" key to keep the previous selection.


CELL FORMATS

Although there are different types of formats that can be applied to the content of a cell, this time we will only know the basics.

  • Font

  • Filling

  • Alignment and orientation

  • Borders


Week 11 - Exam Review (Statistics) / Cover page design

OBJECTIVE OF THE CLASS
To Know the main elements and procedures of a Spreadsheet and also some basic cell formats, through a simple exercise
with the collected results from a form.

BEFORE STARTING…
Let's review together the results of your summative evaluation to recognize which aspects were achieved and which,
although you have seen or worked on them, will remain as a pending signature. Let's look at the results.
NOTE: REMEMBER TO MAKE THE PERIOD COVER JUST AFTER YOUR NOTE BREAKDOWN TABLE.


Tuesday, November 5, 2024

Week 9. Generation of concentrated documents

 OBJECTIVE OF THE CLASS

We explore the generation and analysis of documents, graphs, and statistical tables using Google Forms results. We will understand what they are, how they are created and what they are useful for in different contexts either using real or fictitious examples.


Analyze the collected data Analyze data collected through the “Summary” tool of a Google Form for informed decision making.

What are documents, graphs and statistical tables?

Definition of documents: A document is a file containing textual information, such as text, images and other elements, used to record, present and share information.

Definition of statistical graphs: Graphs are visual representations of numerical data that allow a quick and clear understanding of trends and patterns.

Definition of statistical tables: Tables are an organized way of presenting data in rows and columns to facilitate comparison and analysis.

What are these resources useful for?

Effective communication of results: How documents, graphs and tables help communicate findings clearly and convincingly.

Informed Decision Making: How these resources facilitate data-driven decision making.

Examples of applications in everyday life and in the professional field.

How and where are documents for statistics generated in Google Form?

In plenary we will open a form with answers to begin exploring the documents and information that the form automatically generates.

Now go to the tab of your form called “RESPONSES”

Together we will give a quick review of everything that is there and how it can be useful to us.